Hepatitis C
Hepatitis C is type of chronic viral hepatitis caused by the hepatitis C virus (abbreviated HCV).
It is a type of medical liver disease
General
- Leads to hepatocellular carcinoma in the setting of cirrhosis.
- Tends to be chronic; the "C" in "hepatitis C" stands for chronic.
- Diagnosis is by serology.
Associated pathology:
Microscopic
Features:
- Lobular inflammation - this is non-specific finding.
- Usually Grade 1, rarely Grade 2 and almost never Grade 3 or Grade 4.[1]
- Periportal steatosis in genotype 3.[2]
- Steatosis in hepatitis C is usually a secondary pathology, i.e. a separate pathologic process.[3]
Images
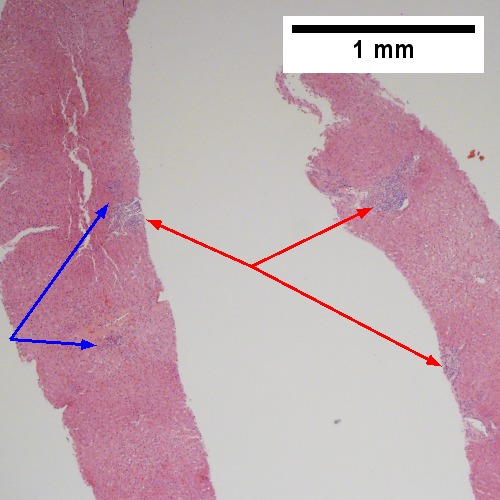
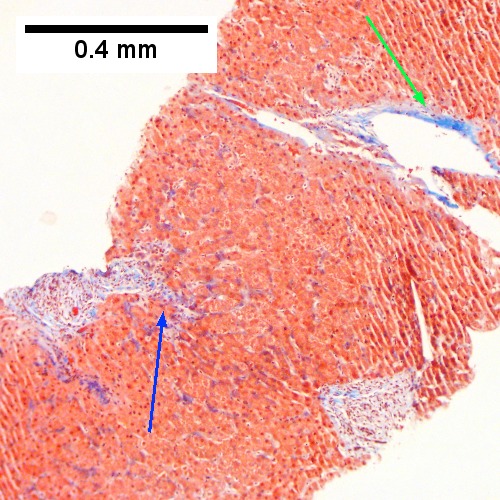
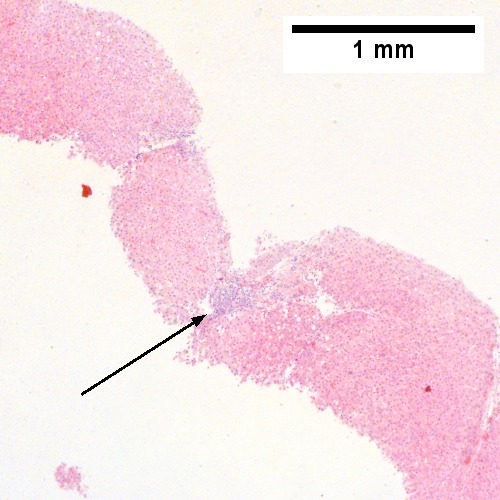
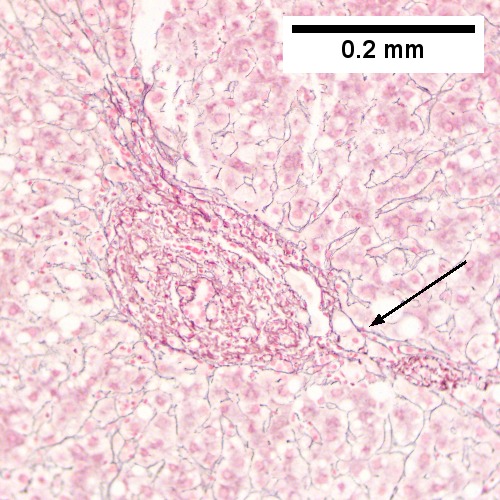
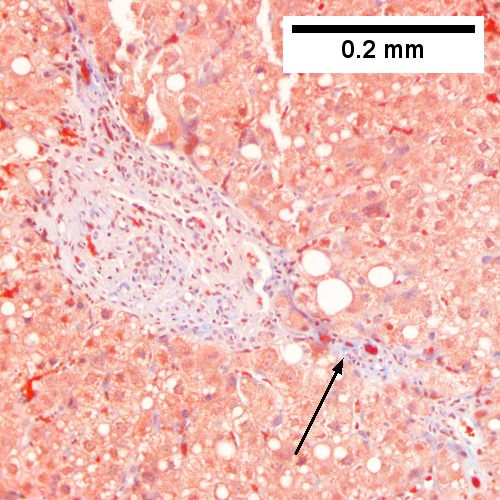
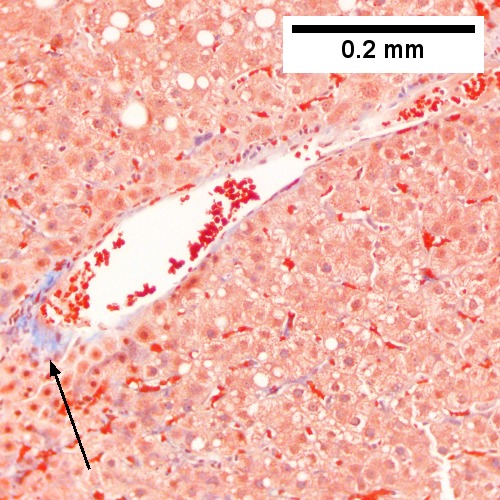
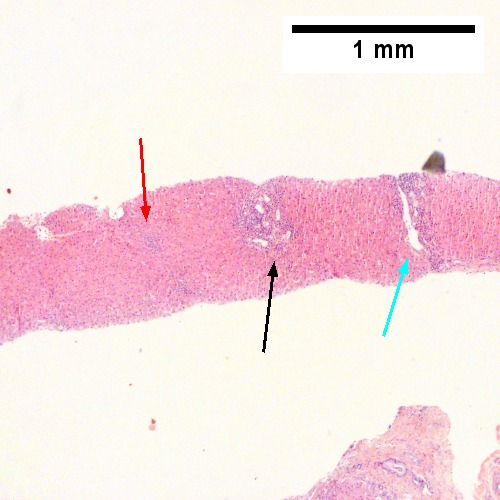
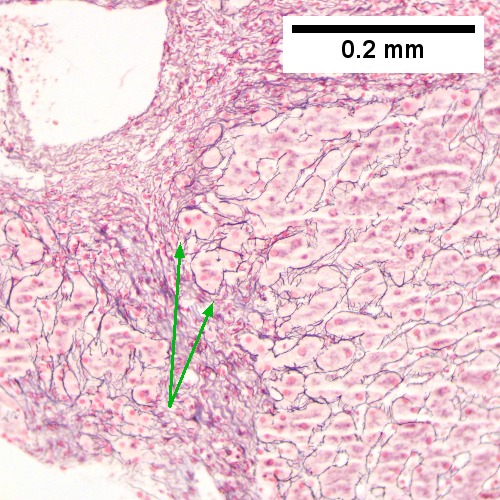
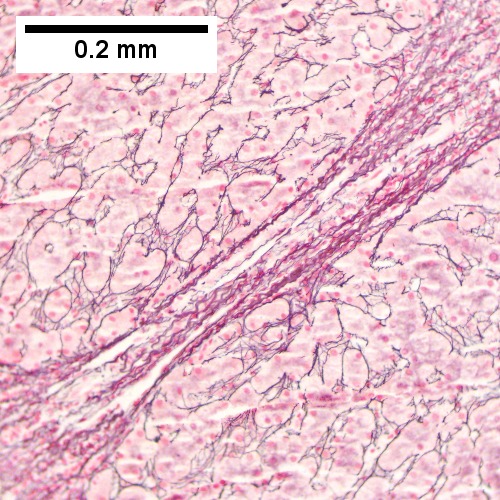
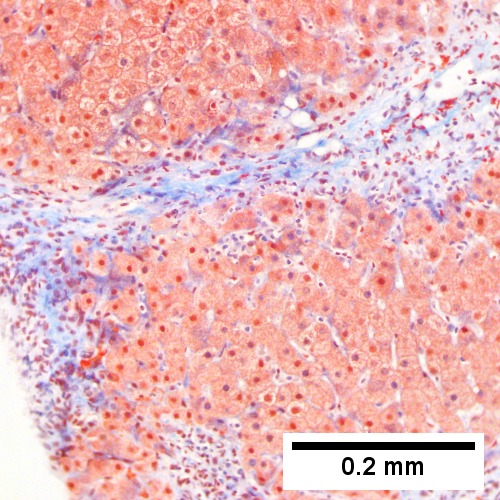
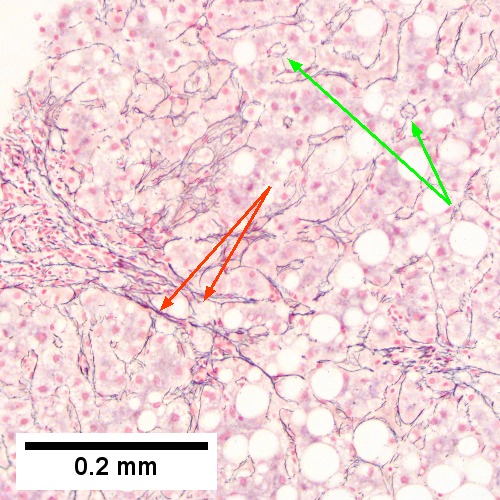
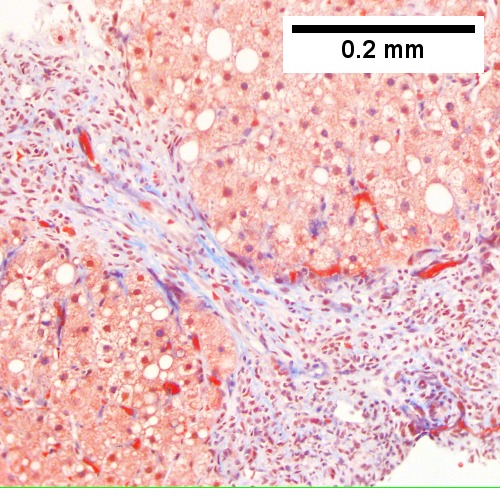
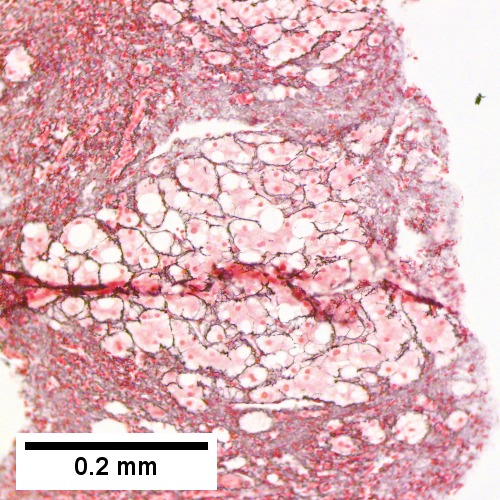
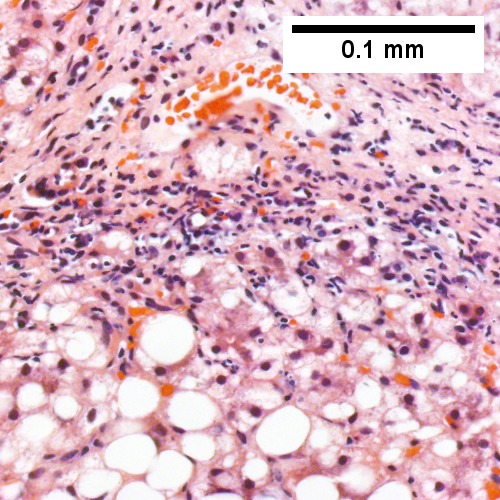
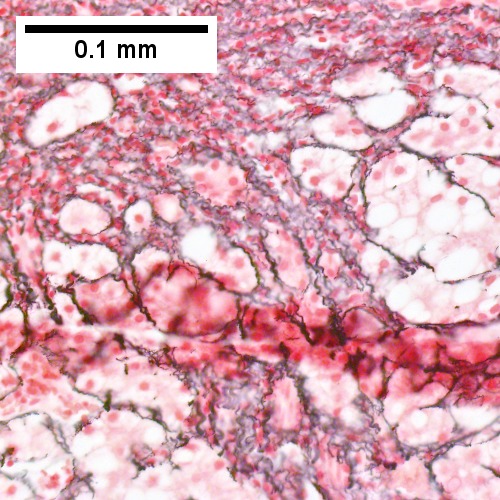
Hepatitis C virus. Metavir Activity Index 1 (PMN 0 LN 1). Preserved architecture shows small, inflamed triads [red arrows] and foci of spotty necrosis [blue arrows] (Row 1 Left 40X). Trichrome shows periportal fibrosis [blue arrow] and central venous sclerosis [green arrow] (Row 1 Right 100X). A higher power view of an inflamed triad with interface hepatitis, but a smooth outline, suggesting no piecemeal necrosis (Row 2 Left 200X). A focus of spotty necrosis near an unafflicted triad below it (Row 2 Right 200X). Reticulin shows collapse [arrows] extending from/near portal triad without piecemeal necrosis (Row 3 Left 200X). Reticulin shows collapse [arrows] extending from/near central vein (Row 3 Right 200X).
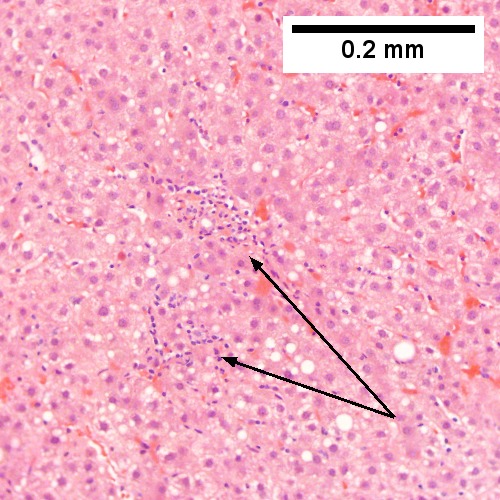
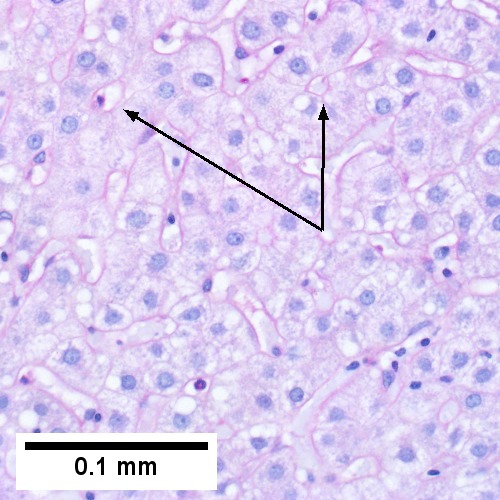
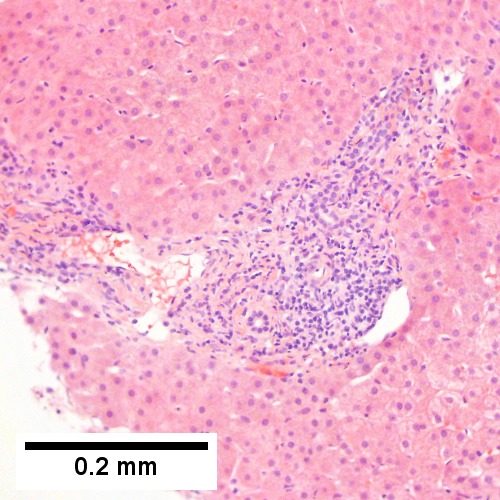
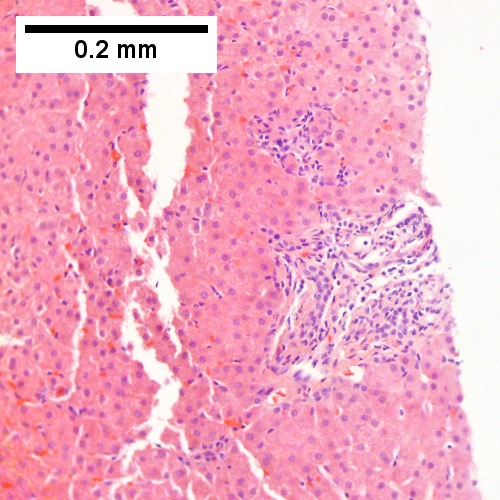
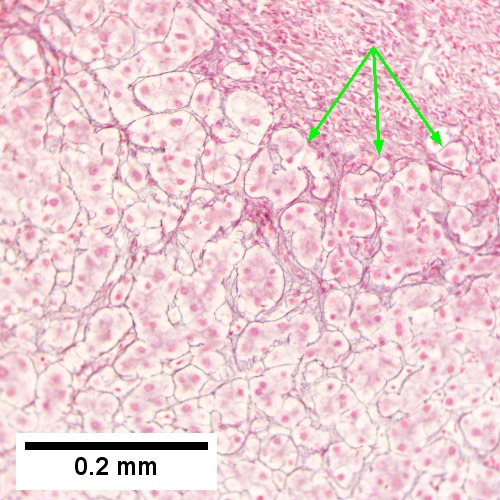
Hepatitis C virus. Metavir activity index 1 (PMN 1 LN 1). Triads show inflammation with extension to portal border (interface hepatitis) (Row 1 Left 40X). Lymphocyte aggregates denote spotty necrosis (Row 1 Right 200X). Reticulin shows focal piecemeal necrosis [arrow] (Row 2 Left 200X). Trichrome shows periportal fibrous extension [arrows] (Row 2 Right 200X). Trichrome shows sclerosis of central vein (Row 3 Left 200X). PAS D can be useful when steatosis frustrates rosette identification; hepatocyte rosettes [arrows] have red edges (Row 3 Right 400X).
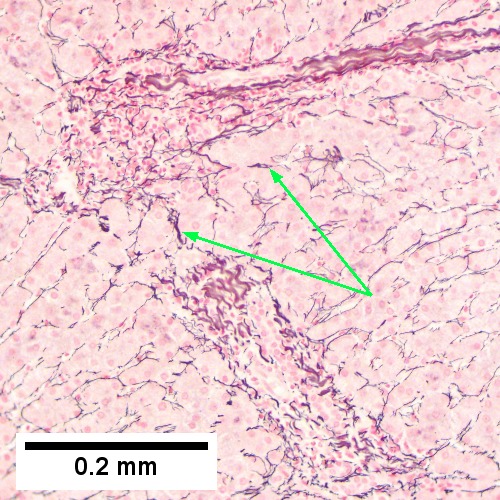
Hepatitis C Virus. Metavir Activity Index 2 (PMN 1 LN 2) Metavir fibrosis stage 3.
Low power showing a focus of spotty necrosis [red arrow], a triad with inflammation bounding its edge (interface necrosis) [black arrow] and a bridge [cyan arrow] (Row 1 Left 40X). Reticulin showing a focus of piecemeal necrosis [arrows], where black lines bound hepatocytes & hepatocyte clusters, not a continuous region (Row 1 Right 200X). Reticulin showing collapse between triads, not a bridge, given cells within strands (Row 2 Left 200X). Trichrome showing collapse between triads, not a bridge, given atrophic cells precluding continuous connection between triads; the fibrosis about the triads is, on each side, a mere spike set (Row 2 Right 200X). Reticulin showing a bridge, given lack of definite hepatocyte type cells within strands (Row 3 Left 200X). Trichrome showing a bridge, with collagenous continuity uninterrupted by hepatocytes (Row 3 Right 200X).
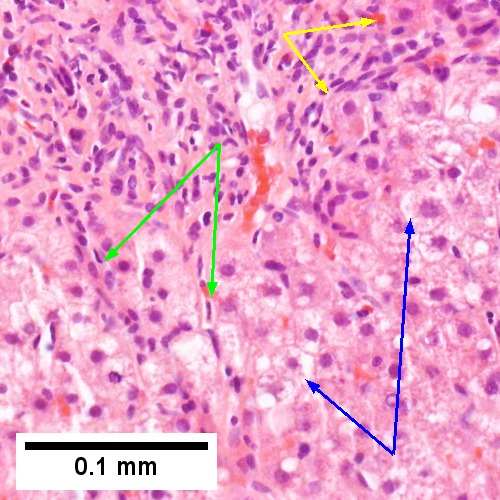
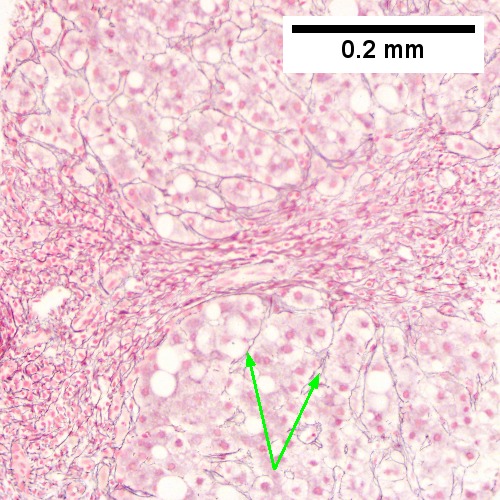
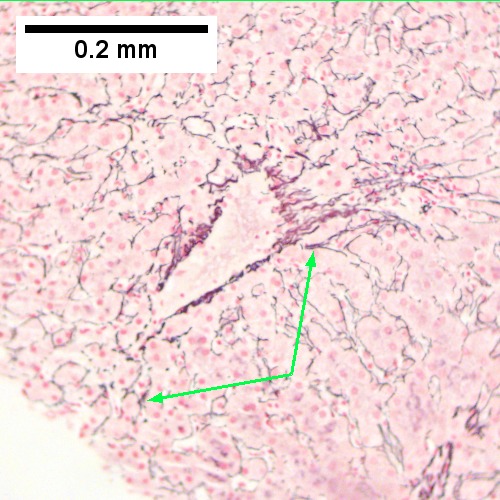
Hepatitis C. Metavir Activity Index 2 (PMN2, LN1), Metavir fibrosis stage 3. Expanded dark triads, indicating interface hepatitis [red arrows], foci of steatosis [green arros], potential bridge [blue arrow] (Row 1 Left 20X). Extending from triad are stretches of apparent necrosis [green arrows], inflammatory cells bound hepatocytes afflicted by piecemeal necrosis [yellow arrows], ballooning degeneration denoted by cytoplasmic tufts [blue arrows] (Row 1 Right 400X). Reticulin shows collapse (necrosis) with thick bands [red arrows], as well as rosettes [green arrows] indicating dilated cholangioles (Row 2 Left 200X). Reticulin here shows continuous piecemeal necrosis with black bounded hepatocyte islets [arrows] (Row 2 Right 200X). Reticulin here shows a bridge with regeneration, wherein two or more nuclei lie between reticulin lines [arrows] (Row 3 Left 200X). Trichrome demarcates one of the bridges (Row 3 Right 200X).
Hepatitis C with metavir stage IV fibrosis (advanced fibrosis/cirrhosis) and confluent piecemeal necrosis. Inflamed bands cross hepatocytes with steatosis (Row 1 Left 40X). Trichrome shows extensive bridges (Row 1 Right 40X). Trichrome also documents early nodule formation (Row 2 Left 40X). Reticulin shows regeneration (two nuclei per cord) in a nodule, but not throughout (Row 2 Right 200X). Hematoxylin and eosin shows piecemeal necrosis as inflammatory cells surrounding hepatocytes (Row 3 Left 400X). Reticulin shows black lines about hepatocytes, indicating confluent piecemeal necrosis (Row 3 Right 400X).
DDx:
- Hepatitis B (without ground glass hepatocytes).
- Autoimmune hepatitis.
- Primary biliary cirrhosis without granulomas.
- Drug reaction.
See also
References
- ↑ STC. 6 December 2010.
- ↑ Yoon EJ, Hu KQ. Hepatitis C virus (HCV) infection and hepatic steatosis. Int J Med Sci. 2006;3(2):53-6. Epub 2006 Apr 1. PMID 16614743. Avialable at: http://www.pubmedcentral.nih.gov/articlerender.fcgi?artid=1415843. Accessed on: September 9, 2009.
- ↑ OA. September 2009.